IT IS Manager APP - Analysis possibilities around sales
IT IS Manager APP - Revenue instruments for analyzing important numbers
Revenue compared to the previous quarter:
How good was the order situation of your company compared to that of the last quarter?
If you like to get to know this, just look at the “Revenue Compare Quarter” area. So you see if the situation is good or if you will need higher selling figures. The chart shows you a column diagram with the revenue of three months and the three months before that.
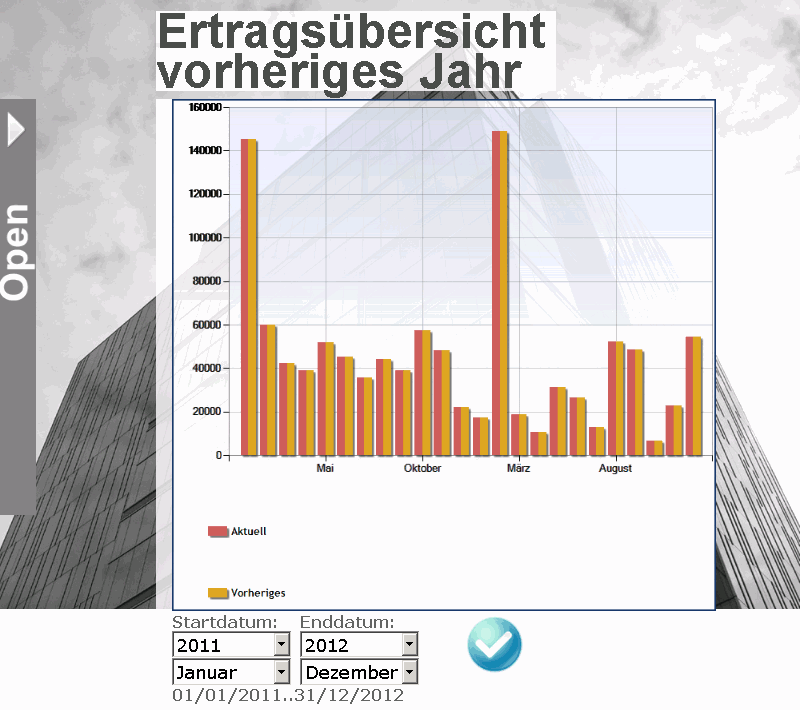
Revenue compared to the previous year:
If you like to compare for example the Christmas trade in December with that of last year, you know if your business figures have raised or not. Type in the desired space of time, and the comparison is shown on your Tablet PC.

See at a glance the course of one year, splitted into the single months. Here, the revenue of the last year was better from April till August - so it is really time now for the manager to get active.
Revenue Cost Development:
For a manager it is important to know if the expenses are covered by the revenue: if not, the company will make a deficit.To find out about those figures, look at the relation of those two factors. The line diagram answers your questions faster than having just a table of numbers - so you are always well informed in real time.
Revenue Budget Comparison:
It is common to forecast your revenue, because you have to make decisions about investing in new items for your company. The revenue budget column diagram displays the actual revenue value of a month in the selected range and compares it with the budget value defined for the same months.
With the top sellers shows which sellers of the company have made what sales over a selectable time. The remaining retailers are summarized as in the sixth part of the diagram.

Learn more about IT IS Tablet Solutions
where to order
Our products are available through our licensed software partner exclusively.
